2019 was the year of revolt against 'statistical significance', with major critiques signed by hundreds of statisticians appearing across many major journals. We're witnessing a fundamental change in how we evaluate and condense academic literature; a tectonic shift away from misapplied frequentist statistical techniques that have led to decades of bad and poorly communicated science. The concept of statistical significance has held back science for the last several decades and it's time to move forward.
The Basics
When we evaluate a causal claim, we split our data into a control group and an intervention group– let's test whether aspirin prevents heart attacks (p<0.0001). Our control group doesn't take aspirin, and our intervention group takes it daily; now we look at each individual's rate of cardiovascular events per year, by group (around 0.5% for both). We assume both the intervention and control data are normally distributed, and we looking to see if data from the intervention group has a different mean than the control.
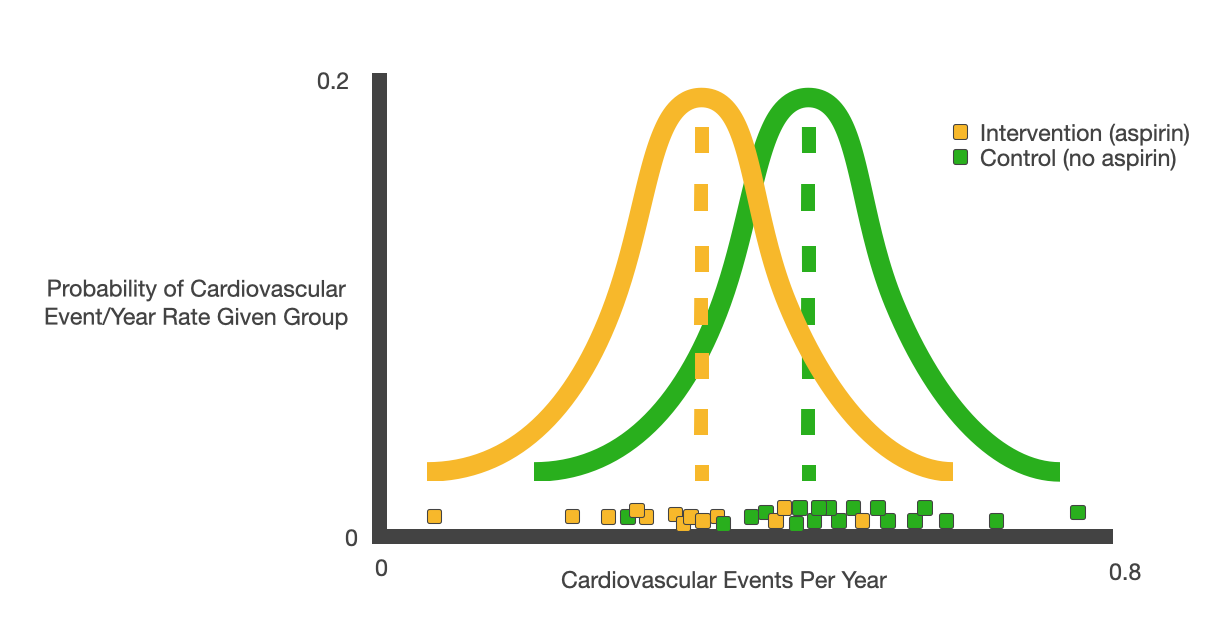
Assuming we have two groups as Gaussians we are sampling from, we can then try to answer some common sense questions. Given the data in the control group, we can estimate a mean and variance– how likely are we to draw the data we see in the intervention group from the control group distribution? How confident can we be in our estimates of means and variances given a certain number of observations?
P-values quantify the likelihood that some observed intervention data is simply the result of randomness in sampling from the control distribution. A statistically significant effect is a categorical distinction on top of that p-value– i.e. we call an effect 'statistically significant' when it would be unusual to observe the intervention data simply by drawing randomly from the control distribution, where 'unusual' is an arbitrary standard.
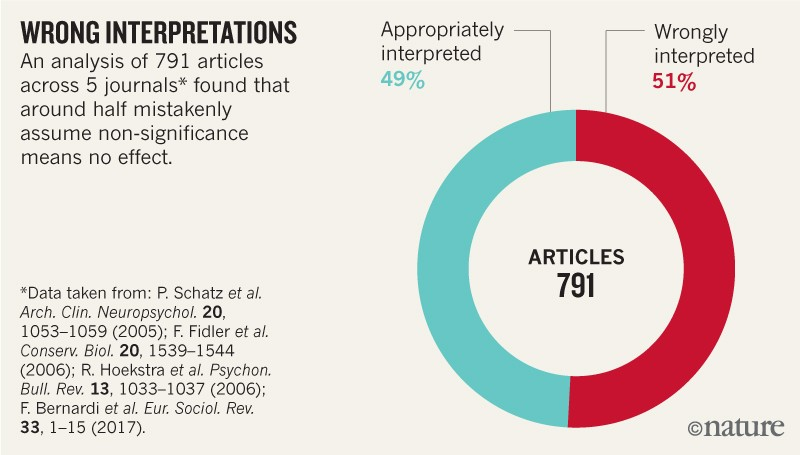
The term 'statistically significant' leads people to conflate measurable effects with significant effects. 'Statistical significance' is meant to convey that the data is suggestive of a true underlying relationship, not that it's a large enough effect to matter practically. 'Statistically significant' relationships are not necessarily important ones.
But the issues with the 'statistically significant' don't just end with its semantics. Even as a way to understand whether data is giving insight into a real underlying relationship, the concept fails without proper context and understanding. Categorical distinctions like this are not useful in the literature and harmful to scientific progress. The term is confusing and we should stop using it– and I'm not the only one that thinks so.
What People Are Saying
Andrew Gelman– one of the best living statisticians– famously published a 2006 paper entitled "The Difference Between “Significant” and “Not Significant” is not Itself Statistically Significant" which showed "that even large changes in significance levels can correspond to small, nonsignificant changes in the underlying quantities." In 'Using Effect Size– or Why the P Value is Not Enough', authors Sullivan and Feinn start their piece by quoting two of the most influential statisticians of the modern era:
Statistical significance is the least interesting thing about the results. You should describe the results in terms of measures of magnitude –not just, does a treatment affect people, but how much does it affect them.
-Gene V. Glass
The primary product of a research inquiry is one or more measures of effect size, not P values.
-Jacob Cohen
The above statisticians are not alone; in 2016, the American Statistical Association officially published a public statement urging caution around the use of p-values. Among many points about the lack of usefulness of p-values, one important point that a "p-value, or statistical significance, does not measure the size of an effect or the importance of a result." They followed it with a 2019 special issue entitled "Statistical Inference in the 21st century: A World Beyond p<0.05". The headline article has a section labeled "Don't Say Statistically Significant":
The ASA Statement on P-Values and Statistical Significance stopped just short of recommending that declarations of “statistical significance” be abandoned. We take that step here. We conclude, based on our review of the articles in this special issue and the broader literature, that it is time to stop using the term “statistically significant” entirely. Nor should variants such as “significantly different,” “p < 0.05,” and “nonsignificant” survive, whether expressed in words, by asterisks in a table, or in some other way.
A 2019 editorial in Nature followed this issue, summarizing the movement against 'statistical significance' in plain language. With more than 800 signatories in the field, they "call for the entire concept of statistical significance to be abandoned."
When evaluating papers, it's much more important to understand the effect size and power, and put that effect in context of what it means with respect to a broader understanding of the subject. Making sense of the literature in a world that statisticians have admitted is fundamentally flawed is a non-trivial exercise for the those of us without a stats degree.
What Statistical Significance Really Means
'Statistically significant' is based on some arbitrary, probabilistic standard– i.e. the data suggests a measurement is unlikely to be the result of random chance. Frequently we set this arbitrary point at 0.05– so if the p-value is less than 0.05, we label a result as 'statistically significant'. That means, if there is no real effect– if we assume our data was the result of random sampling– the odds of seeing this outcome is <5%. Every 20 times we run a test with the criteria p<0.05, if there is no underlying relationship, we'd expect to hit this threshold once.
Of course, this kind of thinking doesn't scale very well across many studies and many researchers. If this was our only standard, we'd expect that for every 20 times someone tests a bogus theory, one result will 'confirm' (p<0.05) a real effect when there isn't one. If every scientist is focusing their effort on implausible theories, the literature will be dominated by false positives– we'd especially expect popular misconceptions to have statistically significant results.
We need data from all of our attempts to study a hypothesis, or else we can't contextualize any single attempt. Since authors tend to publish their positive results and not their negative results (the so-called file-drawer effect), and publications reinforce this bias in the review process (publication bias), we're left with overwhelmingly spurious results in the literature using this simple pass/fail technique on an arbitrary p-value threshold.
It's also very easy to inadvertently p-hack– if we test 20 theories on one set of data, we'd expect 1 to be 'statistically significant' with p<=0.05 even if no true relationships exists. This kind of poor methodology was common in the social sciences for a long time (i.e. test 20 theories on the data you collect, but only publish the one that 'hits' with p<=0.05). It's very natural, when an initial hypothesis fails, to consider other explanations that the data could reveal. Fighting this urge, and rigorously testing only your a priori hypotheses, can be very unintuitive to people with poor statistical literacy. In my opinion, we still do not train people against this rigorously enough. Selectively publishing the details of this kind of approach has dire consequences for the overall trustworthiness of scientific literature.
Beyond the pitfalls of publishing fair and accurate p-values, it's still common to misunderstand them conceptually. It's a subtle but very important distinction to conclude 'repeating this experiment, you'd expect this or larger divergences 5% of the time simply due to randomness' (the correct interpretation) as opposed to 'the odds that my hypothesis is wrong is 5%' (terrible). The American Statistical Association reiterates: 'By itself, a p-value does not provide a good measure of evidence regarding a model or hypothesis.' They are very clear that the existence of an effect or association should never be assessed on p-values alone. If that seems unintuitive to you, don't worry, 86% percent of statistics teachers also get this wrong. (The linked paper, 'Mindless Statistics' by Gerd Gigerenzer, is an excellent and sobering indictment of the modern practice of statistical techniques.) Gigerenzer has also experimentally shown that 40% of psychology professors gravely misunderstand what statistical significance means.
In a vacuum, moving from a p-value to an estimate in the odds of a hypothesis being 'correct' will depend on the effect size and your prior (how likely we believe the hypothesis is of being true). In the broader scientific context, this kind of result would suggest further exploration– the odds of a correct hypothesis would then be revised by considering several studies, each with a different p-value that captures some underlying notion of uncertainty.
If we wanted to comment on the odds that a hypothesis is wrong given a p-value, we need to calculate the positive predictive value (PPV) as explained (excellently) here by Felix Schonbrodt. Based on meta-analysis of these disciplines, we know roughly the likelihood that a study is true given a 'significant' result (26-39% for social science, based on statistical analysis and further corroborated by replication studies). Incorporating this kind of information allows us to guess the likelihood of truth conditional on the information we have available in a Bayesian way.
All of this makes the p-value a remarkably difficult thing to interpret. How can we tell whether a p-value is meaningful when there are is so much bad practice centered around them?
The Heroes we Need
Fortunately, there are ways to understand whether p-values actually mean something. Whenever I have a statistical question, I turn to my favorite sources on the subject– Professor Andrew Gelman's Blog and Professor Ulrich Schimmack's Blog.
As we saw above, it's possible to incorporate some knowledge of the meta-statistics of a discipline to make a quick assessment of the predictive value of a given p-value without further information. But there is a lot more to consider– the same p-value across different contexts can have very different meanings.
Professor Ulrich Schimmack is the best person to look towards for detailed advice on this subject. In his excellent blog post "Men Are Created Equal, P-Values Are Not", he discusses how you can analyze a researcher's p-value distribution and estimate their 'file-drawer rate', the probability of p-hacking, and the likelihood of replication. These kind of analyses take into account the power of a researcher's studies (which we'll talk about in a moment). It's also possible to look at meta-studies and p-score distributions within publications to assess publication bias.
Professor Schimmack takes it one step further with his "Personalized P-Value" post. Beyond bad statistical practices (like file-drawer/p-hacking), different researchers can also have different practices– i.e., they can analyze and prove obviously correct hypotheses with a high hit rate, or they can look for relatively obscure and surprising insights with a low hit rate.
Imagine two researchers– one that investigates the size of obvious effects, and one that's looking for counterintuitive insights. They both perform 20 experiments; the first researcher finds 19 'statistically significant' results with p<0.05, while the second finds only one. If we look at any one of the 'statistically significant' results, can we make a guess about whether one is more likely to be true based on the researcher?
While both approaches are valid and valuable, the same p-value conveys a very different 'likelihood of revealing a real underlying effect'. Luckily, both of these research strategies show up in their p-value distributions.
How to Read (Social Science) Papers
What does this mean for how we read a paper? I'm going to focus on social science (my area of interest), but the same applies for other fields that struggle epistemologically (medicine, neuroscience, and machine learning all come to mind– take at look at the very enlightening 'Are All GANs Created Equal?' from some insight on how this applies to machine learning research).
Sadly, when it comes to making claims about social psychology, at the moment you're better off guessing (or asking your friends) than trusting the literature. Prediction markets do a great job predicting replication; check out this sobering chart from Nature Human Behavior on social science articles published in the top impact journals:
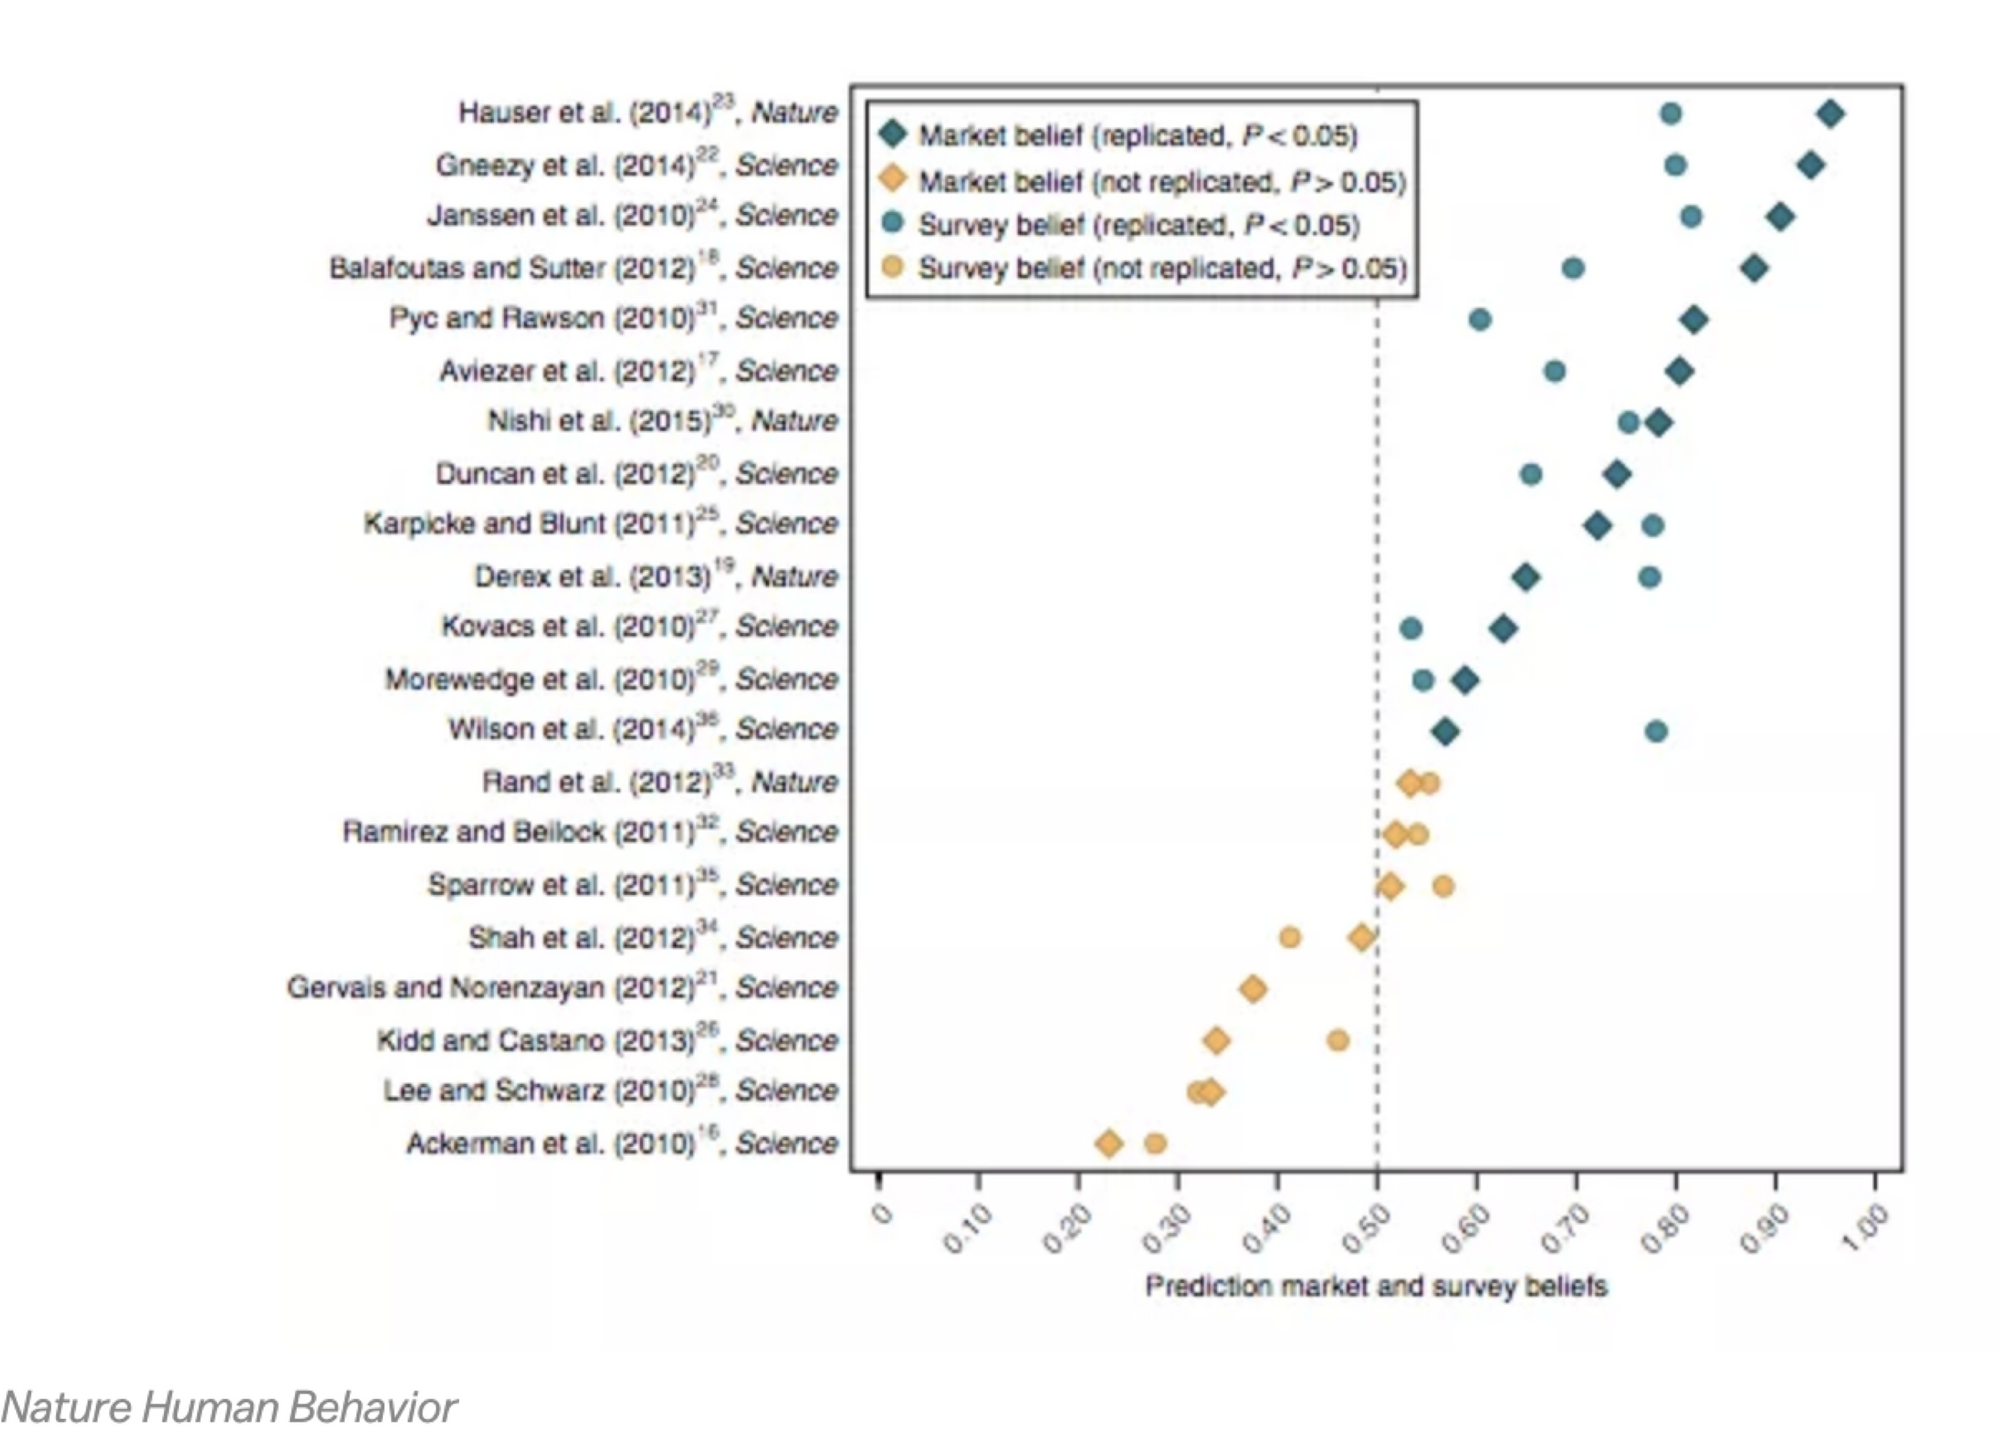
If you can find a scientific prediction market, that's actually a great place to check your instinct about a paper. DARPA is actually funding such a project.
It turns out we all spend quite a bit of our time observing human behavior. You should have strong priors in social science, and in the absence of a consensus mechanism, you should trust your intuition. Moreover, we established earlier that less than 40% of 'significant' studies replicate, regardless of journal (and that number is closer to 26% for social psychology)– so your prior for the truth of a paper should be quite low (a 'significant' result in a paper should bias you towards believing it's more likely false than if you hadn't encountered it in the literature). This trend applies regardless of the year (but hopefully that will change!) *
Furthermore, inaccurate studies are cited significantly more on average, and retractions don't seem to change citation behavior. Meta-analyses suffer from similar problems. Science journalism is very biased and misleading in what they report. As anti-scientific (and horribly depressing) as it is, our simplest and best first-order heuristic is our gut.
But all is not lost. There is real and useful information in the literature if we work hard at extract it. To do so requires a search for replication attempts and meta-analyses (1, 2, 3) supplemented with general background research. Many big ideas have been scrutinized, and there are great blogs and journals that focus on this topic– I highly recommend checking Andrew Gelman's blog, Ulrich Schimmack's blog, Nick Brown's blog, Retraction Watch, Data Colada, Initiative for Transparency in the Social Sciences, Brian Nosek's Center for Open Science (OSF) and their Reproducibility Project, and the Replication Network. You might also skim the writings of Daniel Lakens, Jesse Singal, Gavin Leech, Alvaro de Menard, or Felix Schönbrodt.
There are also several specific concepts that have been discredited. Simple background searches are imperative. It's important to check the Retraction Database to see any notes; if a paper is modern and you can't find any red flags, statisticians like Andrew Gelman recommend scaling all effect sizes down by an 'Edlin factor'– between 1/2 and 1/100 of what is reported– conditional on the methodology.
For a more in-depth analysis of an individual paper, we can also check Shimmack's rankings of the 400 most prominent social scientists and rankings of the top 120 social science journals to see how trustworthy an author/journal combination truly is. His blog is also a gold mine of useful context.
If you really believe a topic is important and no one has done any fact-checking, you can also do it yourself. Nick Brown offers a simple forensic tool for statistics called SPRITE that attempts to back out underlying distributions from summary statistics. Don't be afraid to reverse engineer the analysis.
Taking into account all of this secondary information, it's possible to critically examine the literature with a well informed prior, and to fairly contextualize the power and effect size of a given study. Most of our work for reading a paper in social science must be done at the level above an individual paper.
Useful information is there for us with proper skepticism and scrutiny. Great claims require great evidence.
What does this Mean for Our Research?
So by now we've done our best to destroy the concept of the 'statistical significance' and to rethink our analysis of the existing literature; now how do we apply this to our research? Below are a few best practices to apply to our work.
Report Several Measures (Correctly)
In terms of reporting results, we should report an effect size that has been normalized by the standard deviation (Cohen's D or Odds Ratio), a p-value (without any additional commentary), and a confidence interval (which takes into account the variance normalized by the sample size to give us an estimate of standard deviation over distributions). We should be careful and thorough in interpreting our results– keep the PPV in mind, and do not make the mistake of equivocating a p-value of 0.05 with a 95% chance that your hypothesis is correct as more than half of studies do.
Create an Explicit A Priori Hypothesis and Pre-Register
Most importantly, we should be very explicit about exactly what hypothesis we will be testing before we start our study design and only test that hypothesis; and to make sure we're not wasting time with an underpowered study, we need to set out with an appropriate sample size. You should then pre-register your study publicly, at a place like Wharton's Credibility Lab or The Center for Open Science.
Conduct an A Priori Power Analysis to Choose Your N
If we make a mistake, it will be because we either find an effect that isn't real (type 1 error) or fail to capture an effect that is real (type 2 error). Type 1 errors are clearly more catastrophic, but type II errors are also common in fields where effects are small and noisy, and recruiting large groups of participants is difficult. When we do a power analysis, we can set a threshold for our probability of making a type 1 error (alpha) as well as a type 2 error (beta). A study's power is the inverse of beta (1-beta)– i.e. the likelihood that you measured an effect if one does exists.
We should use a power calculator online (or a tool like UCLA's G*Power) before we do a study to calculate N. We need to know the type of statistical test we're using, the alpha (usually 0.01 or 0.05), the expected effect size, and the power we want to achieve (usually 0.8-0.9). With that information, we can calculate the sample size we'll need to measure an effect if one exists 80-90% percent of the time with a p-value of 1-5%.
Broaden your Toolset
Fisher– the 'inventor' of p-values and the father of modern statistics– was deeply flawed in his thoughts about our ability to reason causally. The tide of Bayesian logic is swiftly overtaking the bad practices he instilled years ago. Even he believed that this kind of analysis was basic and should only be applied where little contextual knowledge was available, and never with a specific p-value threshold. Many of the defining statisticians that followed were very critical of the concept.
There are many other statistical tools available– Gigerenzer points to "descriptive statistics, Tukey’s exploratory methods, Bayesian statistics, Neyman–Pearson decision theory and Wald’s sequential analysis" in his 'Mindless Statistics' review. It's our job to get to know these tools, to spend time understanding the statistics, and to never take a result at face value without understanding the math behind it. Science is contingent on putting in the hard statistical work.
And of course, don't forget the most important bit of advice:
Never Say 'Statistically Significant' Again
* The idea of replication itself is, in many ways, based upon this categorical definition of 'statistically significant'. We can assess 'replication' by looking at a 'statistically significant' result and then forming a wholistic picture to see if that result is accurate-- in this way, there is a very real replication crisis. It's almost impossible to know whether a given paper is accurate at face value and many results that are taken as 'true' are simply not.
It's worth noting, though, that a 'significantly significant' study that then comes up in another, higher powered study as *not* 'statistically significant', doesn't mean the two studies are contradictory, and doesn't necessarily mean that someone utilized poor research methodology. These two datasets can be analyzed and reconciled as a whole, more accurately sculpting an underlying stochastic model of the world. We have to be careful when we talk about the 'replication crisis' as much as any other statistical concept.