In 2014, Facebook published their famous Emotion Contagion study, to massive controversy. This study is still frequently cited as an example of the manipulative potential of social media, which is an egregious characterization. In this post, I'm going to walk through the statistics so we can see what we can really say about the effect of Facebook's intervention on an average person.
Statistically, this study is simple– it's based on a trustworthy and large sample size, and basic statistical tests. The paper only has one figure. Despite that, its remarkably difficult to contextualize. This essay is a deep dive into the numbers– a gut check of the data, and an examination of the common sense inferences we can actually make based on what they report.
The Basics
The study includes 4 groups of ~175,000 people each– 2 intervention groups matched with 2 control groups. Subjects in the intervention groups had either 'positive' or 'negative' posts removed from their newsfeeds, judged based on whether they contain a positive or negative word listed in the 'LIWC'.
Not all of a subject's emotional posts were removed, though– for example, in the positive condition, subjects experienced between 10% and 90% of the positive newsfeed posts removed. This means the 'average' intervention removed half of someone's positive or negative posts.
Over the course of a week, the study measured whether these changes in newsfeed content would alter the number of positive or negative words a subject subsequently used themselves when posting status updates. Changes in word usage should prove that what you see online affects your mood– emotional contagion.
The study includes some interesting basic statistics about facebook usage. Based on their analysis of 3 million posts, an average post is ~41 words. 47% of posts contain a positive word and 22% contain a negative one, so the average positive post has 2.9 positive words and the average negative post has 2.8 negative words. The differing rates of emotional content means positive group interventions are more invasive– deleting half of your positive posts replaces 23% of your news feed, while deleting half of your negative posts replaces only 11%.
The Results
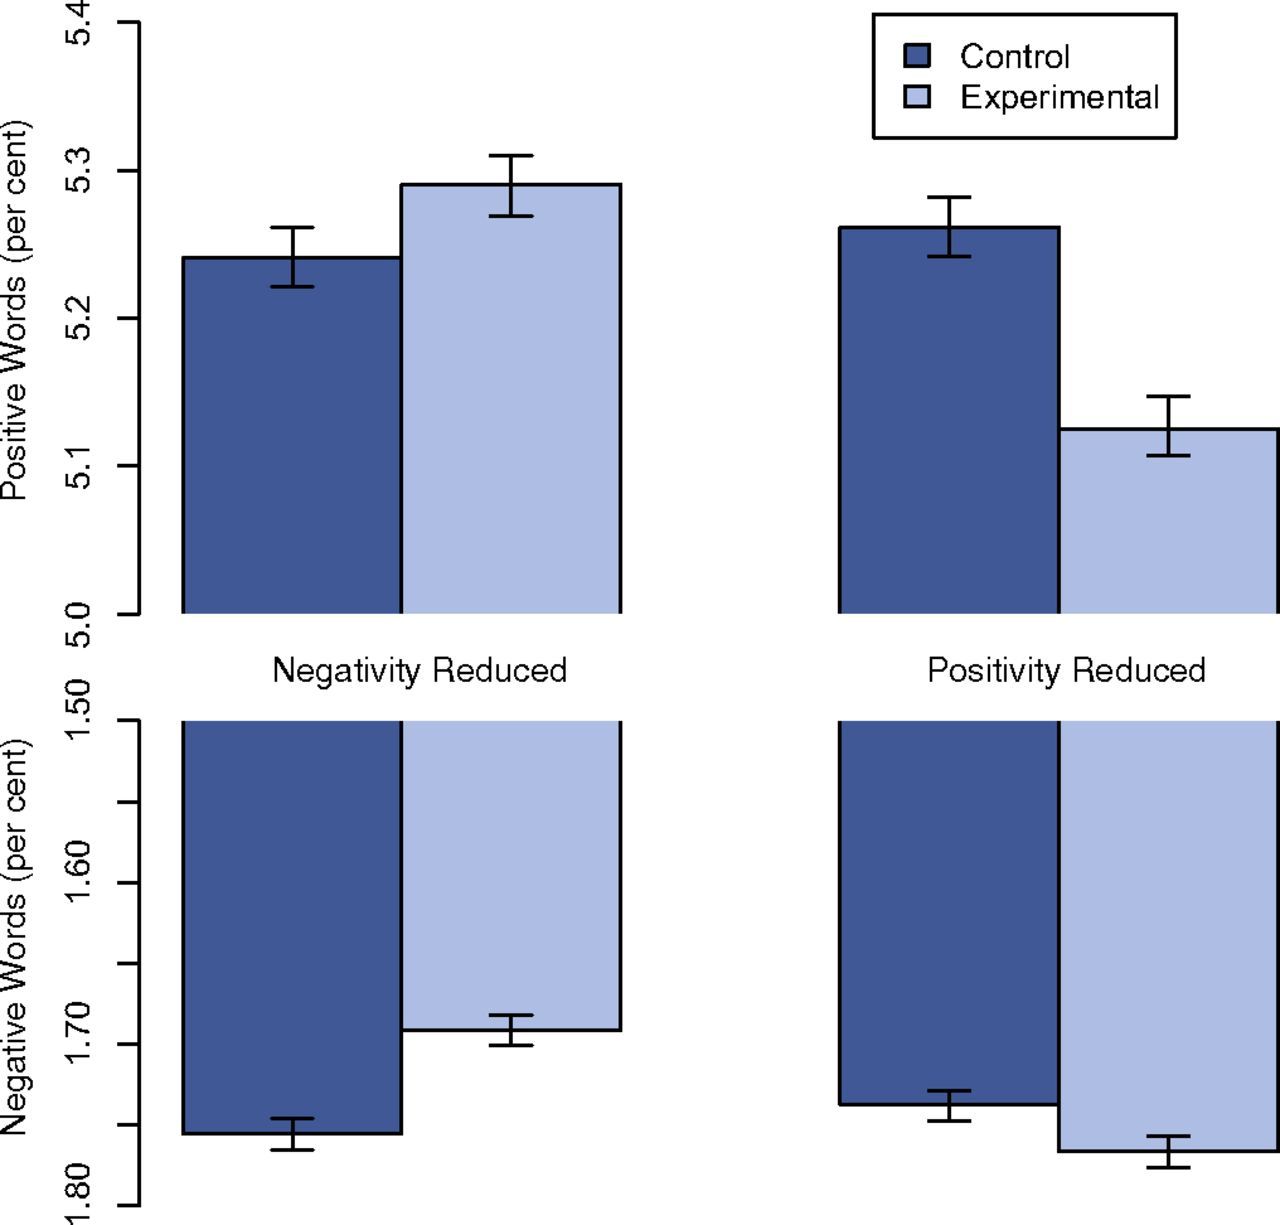
The major results are in the figure below. We see that an average person uses ~5.2% positive words and ~1.75% negative words (dark blue controls).
It turns out that people use fewer words when the content they see is less emotional. By how much? 0.3% fewer words used if negative posts are (on average) half removed, and 3.3% fewer words in the positive case.
These differing rates means we can't compare group-level word averages– since the strength of the intervention varies across subjects, we'd diminish the contribution of individuals who show the greatest effect (a more powerful intervention means fewer emotion words seen, and thus fewer words posted/counted).
To analyze this in a way that maximizes the likelihood of finding an effect, the authors instead train a small weighted linear model to predict the likelihood that a subject will use a positive or negative word in their post that is weighted by the likelihood that the subject had a given emotional post removed. The values we see in the plot above consider intervention subjects that had 90%(!) of their posts removed as 9x more important than people with 10% removed.
Thus, these results are skewed to represent the effect of closer to the weighted average response of ~60%* of the positive or negative posts removed, if we assumed the effect is linear.
But of course we shouldn't expect that. Having a few positive posts removed probably does very little to you, as you'd still see a large amount of positivity; on the other hand, we'd expect a pretty drastic effect if nearly all of your positive posts are removed. It's unlikely the relationship is a simple linear mapping. Because we weigh a 90% user so much more, this analysis really over-emphasizes the effect for people with drastic interventions– it's likely more representative of the experience of someone with 65-75% of their posts removed.
The reported effect sizes heavily emphasize users who received a drastic intervention. It's almost impossible to know the relationship of this effect size with the intensity of the intervention, though a measurable difference in word use exists. Unfortunately, demonstrating that a difference exists isn't particularly meaningful– we really care to know how much of an effect occurs at what intensity of intervention and for whom.
An Unusual Discrepancy
Digging further into the data, we notice overall reported rates of 3.6% positive words and 1.6% negative words, whereas per person results in the figure show 5.2% of the words are positive and 1.7% are negative.
I initially thought there might be an error in the study (3.6% + 1.6% = 5.2%; it looks suspiciously like the positive word results also include negative words). After some back and forth with the authors, they suggested an alternative, unmentioned explanation– an underlying relationship where individuals who use more words use significantly fewer positive words.
This has some serious implications for how we interpret the study.
I was able to roughly corroborate these numbers with other literature. One other study reported, for N=150,000, positive LIWC rates of 3.9% (SD=2.0%) and 1.8% (SD=1.1%) negative rates in status updates overall; in another very small study (N=29) positive LIWC emotion word percentages range from 2% to 57% (average of 10%) per person, and negative word percentages from 0% to 17% (average of 4%). Since this analysis was over several weeks, we can expect slightly higher variability in the shorter Facebook study.
Based on some other literature from the same time period (1, 2), we know that the number of Facebook posts per user follows a power law distribution:
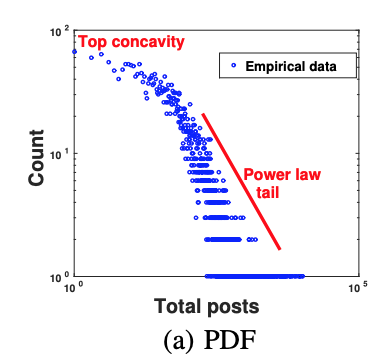
It's unclear what (if any) relationship there is between number of posts and length of post– I couldn't find any data about this. Regardless, it seems reasonable to assume that we'll still end up with a power law distribution in words per person as we do for posting frequency.
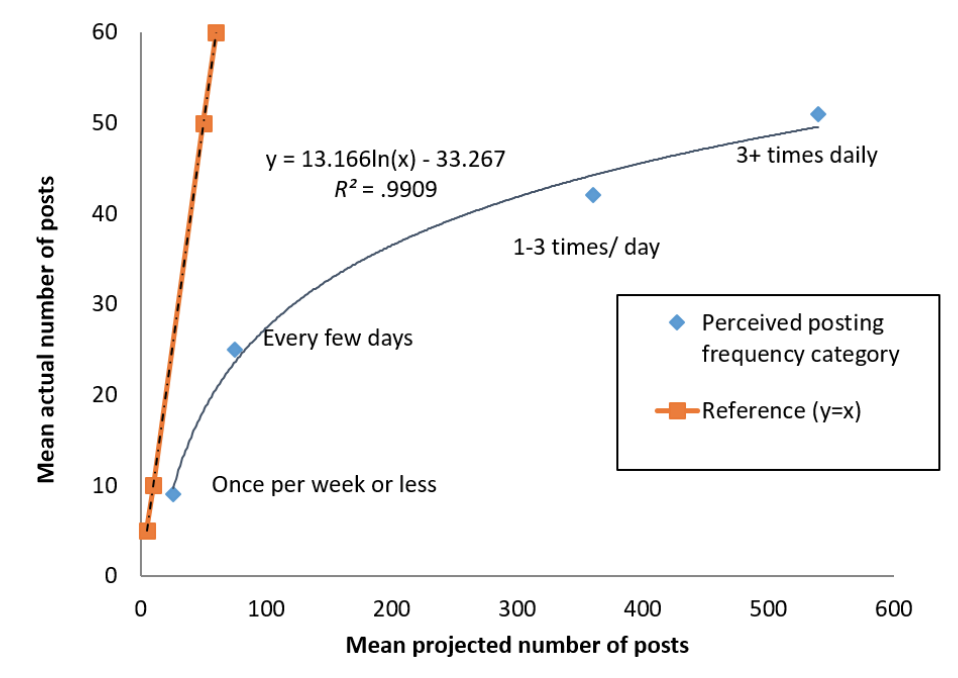
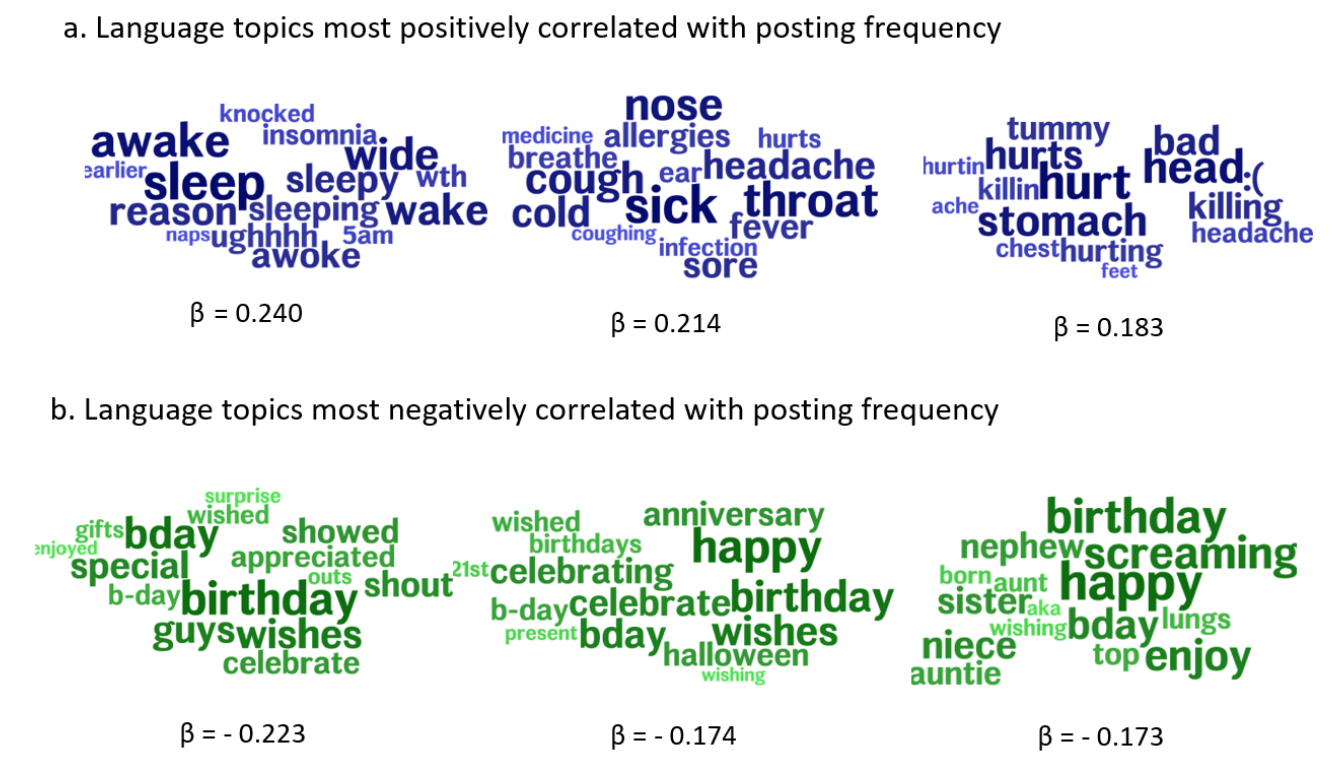
Given this distribution, for the overall positive word rate to be 3.6% with a per person word rate at 5.2%, the vast majority of people are posting very few, very positive posts. Most people post rarely, and it seems reasonable to imagine that most of their posts have to do with celebrations or special events.
In the below cohort study based on (predominantly young, black, and urban) hospital patients, we can see some clear trends that support the idea that positive words are used by people who post infrequently, who make up the vast majority of people (despite the unusual hospital-focused sample). Patients with depression were significantly more likely to post more frequently (38 vs 22 times on average, N=~150, 550), a correlation which has been corroborated in studies outside of hospitals as well.
Contextualizing the Data: What Does it Mean?
In the above sections we established a few key things:
(1) We have baseline positive and negative word use rates of 5.2% and 1.7% per person. In the case of positive words, we know that this 5.2% per person number is heavily influenced by highly positive, infrequent posters who are most representative of the 'typical' user. These users' positive words are probably congratulatory and unrelated to emotional state– though there is a small increase in negative words when positive posts are reduced, so some effect cannot be attributed to this explanation. The averages obscure trends in real underlying behavior of different kinds of users.
(2) The analysis shows very small changes in word use behavior of 0.2 to 0.15%, but what this means for a typical user over intervention severity is unclear. The technique is heavily weighted to represent a drastic intervention– something roughly like removing 70% of emotion posts from a person's feed.
If we put aside that these small effects are likely a result of infrequent congratulatory or conciliatory posts in response to personal news, we can focus on the smaller secondary effect (a.k.a. fewer positive posts sparking more negative words and vice versa). While these small changes can be explained as a very subtle sort of social mirroring (fitting in with group behavior), they also could perhaps capture some real change in underlying emotional state. Do they?
Does Your Positive Word Count Reflect Your Positive Emotions?
Based on this study from 2015 (N=200), increased LIWC negative word use reflects real anxiety, depression, and stress, while positive word use is uncorrelated with psychological indicators.
This correlation is strongest in young people; younger people are more self-disclosing on social media and use more emotion words, so their linguistic features might be more relevant. Older people are more prone to 'image management', which might also explain a decoupling between positive words and underlying emotional states. Other studies back up the notion that positive words correlate with image management and not emotional state.
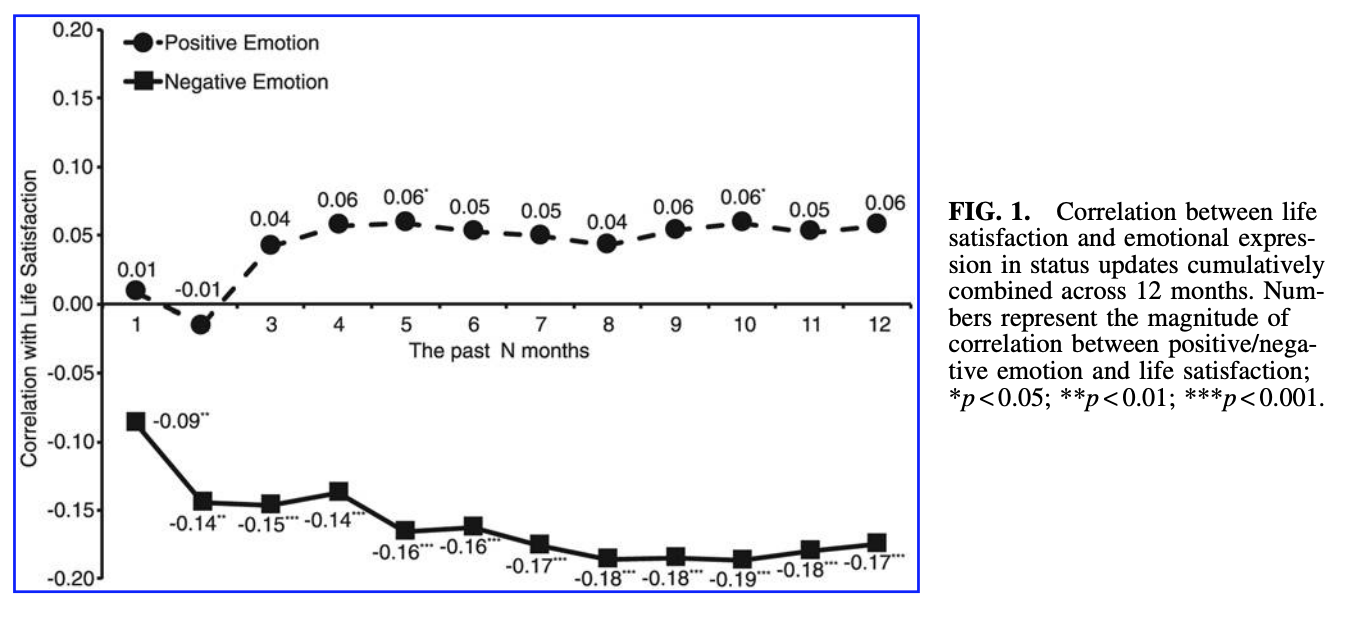
"Do Facebook Status Updates Reflect Subjective Well-Being?"– a study from 2015– shows that for 1,100 participants, subjective wellbeing and the LIWC score are only related when users show evidence of negative language in the last 9 months. If you look at the graph below, you can see that just looking at word usage over the most recent month or two is not at all predictive of subjective well-being; data over the last 8-10 months becomes a meaningful indicator, and adding data beyond 10 months reduces the correlation. While it is a real correlation, it is still a very, very weak one (<0.2). Once again, positive word use is simply not meaningfully predictive at all.
Another study from 2018, "Does Counting Emotion Words on Online Social Networks Provide a Window Into People’s Subjective Experience of Emotion? A Case Study on Facebook", showed no relationship between LIWC word percentage and self-reported affect; however, human judges reading the posts were able to predict affect poorly but meaningfully (correlations around 0.15.) They summarize their results (for 185 college students) by quoting Pennebaker et al (2003):
Virtually every psychologically based text analysis approach has started from the assumption that we can detect peoples’ emotional states by studying the emotion words they use... [but] in reviewing the various word use studies, it is striking how weakly emotion words predict people’s emotional state... taken together, it is our sense that emotion researchers should hesitate before embarking on studies that rely exclusively on the natural production of emotion words. (p. 571)
Finally, "Emotional States vs. Emotional Words in Social Media" (2015) found similar weak (~0.15) correlations between affective ratings and LIWC scores across 515 Facebook users:
...although we found a reliable correlation between negative affect on the PANAS and negative sentiment as measured by LIWC for Facebook status updates, at best the LIWC scores account for 4.2 percent of the variance in one’s reported negative affect.
Their analysis corroborates that 6 months of data is required, and suggests that this kind of analysis really only makes sense for a small subset of self-reported 'highly emotionally expressive' people.
The conclusion is clear– in no way are changes in a week's worth of LIWC emotion word data indicative of any underlying emotional changes in Facebook users. Even over long time scales, positive words seem meaningless as a predictive tool of underlying emotional state.
Finally
The Facebook Emotion Contagion study shows incredibly small changes in emotion word rates from an invasive intervention. These changes seem to be explained largely by common usage patterns (a typical user will post an infrequent, congratulatory post on a positive personal announcement); for the unaccounted difference that remains, there is substantial evidence refuting the idea that LIWC word choice captures anything meaningful about a user's emotional state. For even the most severe manipulations, we cannot trace a causal pathway through user emotional.
For such a simple study, it is remarkably hard work to contextualize for typical Facebook users. The paper uses statistical techniques that increase the probability of finding an effect at the expense of obscuring how large of an effect occurs at what intensity of intervention and for whom. The point estimates we're given are reweighted by intervention type and averaged over an uneven distribution of users.
That makes our job– to contextualize the meaningful implications– significantly harder. Effect size matters. Missing this nuance not only can create a media firestorm over a totally benign intervention, it can also undermine the scientific value of the research.
* ∫x*p(x) from .1 to .9, where p(x) = x / (∫x from .1 to 0.9) to normalize it so it's a probability distribution with area 1.